Visualisation
Behaviour trees are significantly easier to design, monitor and debug with visualisations. Py Trees does provide minimal assistance to render trees to various simple output formats. Currently this includes dot graphs, strings or stdout.
Ascii/Unicode Trees
You can obtain an ascii/unicode art representation of the tree on stdout
via py_trees.display.ascii_tree() or py_trees.display.unicode_tree():
-
py_trees.display.ascii_tree(root, show_status=False, visited={}, previously_visited={}, indent=0)[source] Graffiti your console with ascii art for your trees.
Parameters: - root (
Behaviour) – the root of the tree, or subtree you want to show - show_status (
bool) – always show status and feedback message (i.e. for every element, not just those visited) - visited (dict) – dictionary of (uuid.UUID) and status (
Status) pairs for behaviours visited on the current tick - previously_visited (dict) – dictionary of behaviour id/status pairs from the previous tree tick
- indent (
int) – the number of characters to indent the tree
Returns: an ascii tree (i.e. in string form)
Return type: Examples
Use the
SnapshotVisitorandBehaviourTreeto generate snapshot information at each tick and feed that to a post tick handler that will print the traversed ascii tree complete with status and feedback messages.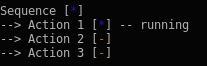
def post_tick_handler(snapshot_visitor, behaviour_tree):
    print(
        py_trees.display.unicode_tree(
            behaviour_tree.root,
            visited=snapshot_visitor.visited,
            previously_visited=snapshot_visitor.visited
        )
    )

root = py_trees.composites.Sequence("Sequence")
for action in ["Action 1", "Action 2", "Action 3"]:
    b = py_trees.behaviours.Count(
            name=action,
            fail_until=0,
            running_until=1,
            success_until=10)
    root.add_child(b)
behaviour_tree = py_trees.trees.BehaviourTree(root)
snapshot_visitor = py_trees.visitors.SnapshotVisitor()
behaviour_tree.add_post_tick_handler(
    functools.partial(post_tick_handler,
                      snapshot_visitor))
behaviour_tree.visitors.append(snapshot_visitor)
- root (
XHTML Trees
Similarly, py_trees.display.xhtml_tree() generates a static or runtime
representation of the tree as an embeddeble XHTML snippet.
DOT Trees
API
A static representation of the tree as a dot graph is obtained via
py_trees.display.dot_tree(). Should you wish to render the dot graph to
dot/png/svg images, make use of py_trees.display.render_dot_tree(). Note that
the dot graph representation does not generate runtime information for the tree
(visited paths, status, …).
Command Line Utility
You can also render any exposed method in your python packages that creates a tree and returns the root of the tree from the command line using the py-trees-render program. This is extremely useful when either designing your trees or auto-rendering dot graphs for documentation on CI.
Blackboxes and Visibility Levels
There is also an experimental feature that allows you to flag behaviours as blackboxes with multiple levels of granularity. This is purely for the purposes of showing different levels of detail in rendered dot graphs. A fullly rendered dot graph with hundreds of behaviours is not of much use when wanting to visualise the big picture.
The py-trees-demo-dot-graphs program serves as a self-contained example of this feature.